
Most board evaluation data is a snapshot. Ours isn't. When we followed 50 boards across repeated evaluations, the highest-rated boards weren't defined by brilliance. They were defined by the absence of serious weakness, and by what they did between measurements.
Most claims about what makes a good board come from a single point in time. Survey a set of boards once, compare the strong to the weak, and describe the difference. That approach can't answer the questions that matter most to directors: what actually changes, how fast, and in which order.
This analysis is different. It draws on 50 boards that have run structured evaluations with us more than once, across windows of one to three years. Every board in it has a before and an after. That's a smaller group than our full evaluation dataset, and it's a particular group: boards engaged enough to keep measuring. But it's the only kind of data that can show movement rather than position, and movement is where the useful findings are.
The strongest boards have no craters
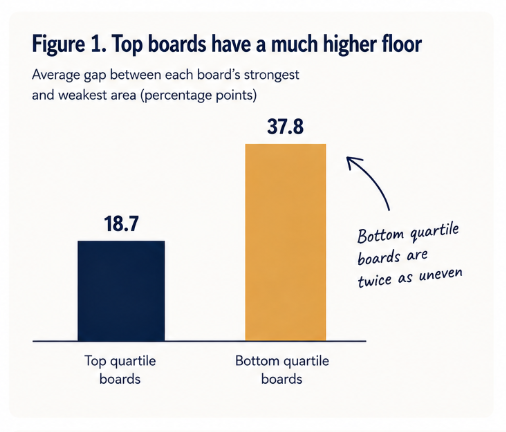
Start with the clearest pattern. The highest-rated boards in this cohort are not dramatically better at everything. What distinguishes them is consistency. Their weakest areas are still relatively strong, and the gap between what they do best and what they do worst is small.
For boards in the bottom quartile of our cohort, the average gap between their strongest and weakest areas is 37.8 percentage points. For top quartile boards, it's 18.7. Bottom quartile boards are twice as uneven.
A weaker board can still have a well-regarded chair, functioning committees and a constructive relationship with management. Even in the bottom quartile, chair leadership averages 83 per cent positive sentiment. The mechanics work. Somewhere else, though, there's a crater. Succession. Composition. Risk.
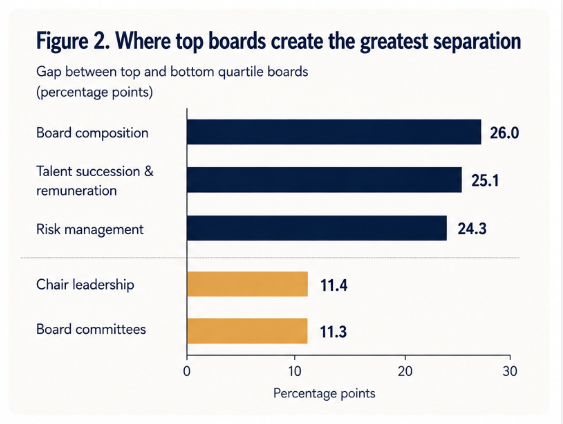
The separation between strong and weak boards sits in the hard human questions, not the process ones. The largest gaps between top and bottom quartile boards are in board composition (26.0 points), talent succession and remuneration (25.1) and risk management (24.3). The smallest are in chair leadership (11.4) and board committees (11.3). Weak boards aren't failing at governance mechanics. They're struggling to answer whether they have the right people, and what happens when those people leave.
Boards fall faster than they climb
It is important to understand how boards arrive in the bottom quartile. The assumption is that weak boards were always weak. In our cohort, half of them weren't. Six of the twelve boards that finished in the bottom quartile started somewhere higher, some of them near the top.
When boards fall, the damage concentrates in the same places: succession and strategy decline hardest. That pattern is what a disruptive event looks like in sentiment data. A contested leadership transition. A strategic disagreement the board can't resolve. A departure that exposes how thin the bench was. Bottom quartile is often not a chronic condition. It's an event, and it can happen to boards that looked strong a cycle earlier.
The asymmetry matters too. A board can fall in a single evaluation cycle. Climbing back typically takes two or three. Confidence, like trust, breaks faster than it builds. And no board in our cohort reached the top quartile by fixing one thing: the strongest improver gained ground in all eleven areas we measure. Improvement, when it's real, is board-wide.
What actually changes between evaluations
Boards that evaluate repeatedly do improve: the median board in our cohort gained 2.6 points of positive sentiment between evaluations. But the improvement isn't evenly spread, and the pattern is telling.
The areas that improve on their own are the visible, actionable ones: chair leadership, board processes and papers, committees, monitoring of business performance. These respond to being measured. Put a finding in front of a board and the fix is usually clear.
Two areas don't move on their own: talent succession and risk management. Across the whole cohort, neither shows meaningful improvement between cycles without deliberate work. They're also the two areas where we see the biggest gaps between strong and weak boards. The dimensions that separate the best boards from the rest are precisely the ones that don't improve by default.
Improvement also travels in pairs. Two connections stand out in our data, and both hold up under strict statistical testing. Boards that renew their composition see committee effectiveness rise with it: new directors mean reconstituted committees, refreshed chairs of audit and remuneration, and both scores move together. And boards that lift their strategy engagement lift stakeholder engagement in lockstep, because a genuine strategy process forces the board outward, into shareholder, community and regulatory context. Composition work is a two-for-one. So is strategy work. Beyond those two pairs, there's no evidence that fixing one area drags another along with it. Improvement is either board-wide or it's the specific thing you worked on.
The chair tells you where you are. Risk tells you what will still be broken next year.
Two dimensions deserve special attention, for opposite reasons.
The chair score is the best single read of overall board health in our data. Where a board rates its chair today is the strongest indicator of where the whole board's sentiment is heading next. Not because chairs cause everything, but because directors' confidence in the chair is the most efficient summary of how the board is really travelling. If you could ask only one question about a board, ask about the chair.
But here's the twist: chair scores are also the most self-correcting dimension we measure. A weak chair rating usually recovers substantially by the next evaluation. Risk management is the opposite. Weak risk scores are the most persistent result in our data. Most low scores bounce back on their own. A low risk score usually doesn't. If your board is rated poorly on risk, that's not a bad year. On the evidence, it's a position that holds until something changes it. Frameworks, appetite statements and reporting disciplines take multiple cycles to bed in, and the data shows it.
Read together: the chair score tells you where the board is. The risk score tells you what will still be broken next year if nobody acts.
Succession moves with everything else
Of all the areas we measure, succession stands out in two ways.
First, it's the weakest area everywhere. It's the lowest-rated dimension for bottom quartile boards (56 per cent positive) and it's also the lowest-rated dimension for top quartile boards (81 per cent). Even the best boards are least confident about succession.
Second, it moves in step with overall board health. When a board's sentiment improves broadly, succession improves with it, and when a board declines, succession declines with it. It's also where falling boards fall hardest. Among boards that started in our bottom quartile, succession was the single biggest gainer by the next evaluation, up 18.4 points on average. To be clear about what this is and isn't: succession doesn't predict where a board is heading. It reflects, faster and more visibly than most dimensions, where a board already is. It's a thermometer, not a forecast.
That still makes it the right place to look. Succession forces a board to confront its hardest questions. Is the CEO right for what comes next? Is there a credible successor? Does the board itself have the right capabilities, and who needs to be renewed? These are questions boards can postpone. The postponement shows up in the data.
Staying at the top is work
One more finding only repeated measurement can produce: gravity. Across the cohort, scores above 90 per cent fell more often than they rose. Excellence mean-reverts. The exception was the top quartile boards themselves, whose highest scores held their ground. The best boards aren't just higher. They're the only group in the data that resists the pull downward.
Position at the top is defensible, not permanent. Half the boards that started in our top quartile were still there at the next evaluation. The other half had been displaced, sometimes by boards that had been near the bottom a cycle or two earlier. Combined with how fast declines happen, the message for strong boards is not reassurance. It's maintenance.
Protecting the downside
Board excellence is usually described in aspirational terms. Great strategy, strong culture, exceptional leadership. All of that matters. But the boards that rate highest, and stay there, do something less glamorous. They protect the downside. They don't let succession drift until a transition forces the issue. They don't leave a weak risk result for the next review, because the data says it will still be there. They notice when confidence in the chair starts to slip, because that's usually the first sign of something broader. They keep the floor high, and they keep measuring.
For directors, that suggests a simple question to take into the next board review:
Where are we weakest, and what happens if that weakness comes under pressure?
A single evaluation will tell you where that weakness is. Only the next one will tell you whether you dealt with it.

